OSD Request Processing Latency
TweetHow fast can RADOS process a request? The answer depends on a lot of factors such as network and I/O performance, operation type, and all sorts of flavors of contention (e.g. too few PGs). Today we'll focus on the latency added due to request processing inside an OSD.
We are going to do our performance analysis by post-processing execution traces collected using LTTng-UST. Check out Tracing Ceph With LTTng for more information on instrumenting Ceph.
Let's start by profiling the performance of the RADOS create operation.
First we need to create a workload generator. It couldn't be simpler: call
ioctx.create with a unique object name in a loop and record the latency of
each operation. Here is the kernel of the workload tool:
for (int i=0;; i++) {
    std::stringstream oid;
    oid << "obj." << i;
    uint64_t start = get_time();
    ioctx.create(oid.str(), true);
    uint64_t duration = get_time() - start;
    // log (start, duration)
}
Client Observed Latency
I ran this workload for five minutes against a single OSD using the in-memory object store. The experiment collected approximately 250,000 operations. Here is the distribution of latencies as observed by the client. With the exception of some outliers, the expected latency is about 1.1 milliseconds. That's a pretty long time, considering we are going over the loopback and never touching an I/O device!
|(ms) |Client | |mean | 1.145| |std | 0.102| |min | 0.597| |25% | 1.103| |50% | 1.144| |75% | 1.187| |max | 12.700|
These latencies reflect everything, such as client library overhead, the network round-trip, and all request processing that occurs in the OSD. What contributes to the high latency? Next we'll look at a subset of the processing that occurs in the OSD.
OSD Operation Handling
The following graph shows the typical execution flow that an OSD follows
while processing a client request. Starting at the top left the Messenger
dispatches a message to the OSD which finishes by placing the request on the
OpWQ workqueue. One can think of the dispatch phase as being analogous to
the top half of an IRQ handler.
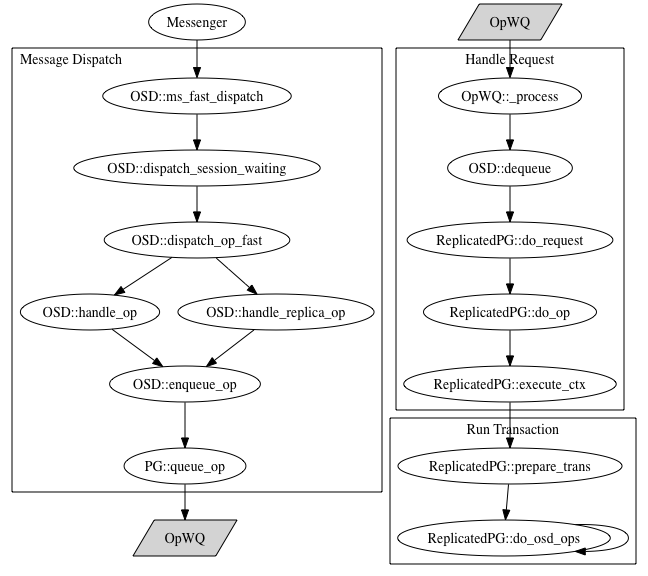
A queued operation is plucked off of OpWQ by a worker thread, and this is
where the actual work associated with an operation occurs. Continuing with our
IRQ analogy, this is like the bottom half handler. We further separate this
phase into the portion that executes the transaction associated with the
request. We've instrumented the OSD and client using LTTng-UST, collected
traces, and broken down request processing latency by phases.
Message Dispatch
The message dispatch latency represents the amount of time taken by the OSD, following message receipt, to perform any initial processing and place the request on the workqueue.
|(ms) |Client |Dispatch| |mean | 1.145|0.094 | |std | 0.102|0.005 | |min | 0.597|0.053 | |25% | 1.103|0.093 | |50% | 1.144|0.093 | |75% | 1.187|0.094 | |max | 12.700|1.138 |
So this is pretty fast at around 9 microseconds. The max time taken was about 1.1 milliseconds, so that isn't what caused our huge 12 millisecond latency.
Queue Latency
Once a message has been placed on the workqueue it sits idle until a worker thread gets off its ass and handles it.
|(ms) |Client |Dispatch|OpWQ| |mean | 1.145|0.094 |0.042| |std | 0.102|0.005 |0.011| |min | 0.597|0.053 |0.000| |25% | 1.103|0.093 |0.038| |50% | 1.144|0.093 |0.041| |75% | 1.187|0.094 |0.045| |max | 12.700|1.138 |0.668|
Alright, so we can add on about 4 more microseconds that the request is sitting in the queue. Still, we don't know what caused the max client latency.
Request Handling
The request handling latency added to the table below shows the time taken by a worker thread to handle a request. Check out the max: we've narrowed down where that big latency came from. It doesn't tell us exactly what happened, but it does tell us interesting things like it probably wasn't the network or queuing delay (we need more instrumentation points to really get to the bottom of things).
|(ms) |Client |Dispatch|OpWQ|Req Handling| |mean | 1.145|0.094 |0.042| 0.225| |std | 0.102|0.005 |0.011| 0.078| |min | 0.597|0.053 |0.000| 0.122| |25% | 1.103|0.093 |0.038| 0.215| |50% | 1.144|0.093 |0.041| 0.221| |75% | 1.187|0.094 |0.045| 0.228| |max | 12.700|1.138 |0.668|11.637|
Now things are starting to add up. Note that in this phase we have a large latency. It looks like that big client spike probably came from here (although this isn't a definitive test).
Transaction Handling
Finally, we show latencies for the portion of request handling that corresponds to the actual operation specific transaction. Note that the latencies described in the previous sections are non-overlapping phases in that their latencies add together. However, transaction handling described here is a subset of the request handling phase.
|(ms) |Client |Dispatch|OpWQ|Req Handling|Tx Handling| |mean | 1.145|0.094 |0.042| 0.225|0.021| |std | 0.102|0.005 |0.011| 0.078|0.002| |min | 0.597|0.053 |0.000| 0.122|0.011| |25% | 1.103|0.093 |0.038| 0.215|0.020| |50% | 1.144|0.093 |0.041| 0.221|0.020| |75% | 1.187|0.094 |0.045| 0.228|0.020| |max | 12.700|1.138 |0.668|11.637|0.161|
Check out the max row again. Since transaction handling is a subset of the request handling phase we can completely rule out transaction handling as the cause of the large latency. The large latency is happening some where else in the request handling phase.
This is just touching the surface of latency analysis. Stay tuned for more!